Power BI for Digital Marketing
Are you tired of pulling data from multiple marketing sources, tools and analyzing them? Start using Power BI and make your digital marketing efforts a lot easier. Digital marketing refers to advertising through digital channels. These include websites, search engines, social media, e-mails and mobile applications. It is a core part of any company’s marketing strategy. Customer outreach is the main objective of digital marketing efforts. Power BI turns digital marketing data into compelling dashboards and reports within a few minutes.
Social Media
Many companies are investing money for promoted content and advertisements on two key social media outlets – Twitter and Facebook. You can customize your Power BI dashboard with Facebook data. There is a data connector readily available to accept Facebook data from Power BI’s Open Graph Application Programming Interface (API). For instance: likes, posts, comments, and shares. Twitter has no API available to connect to your analytical data, regardless of your BI platform, lest Power BI. Although, there is no connector to accept Twitter API, there are methods to do this.
One way is to use Azure Steam Analytics to access real-time data. Another way is to import your Twitter analytics manually into Power BI.
E-Mail Marketing
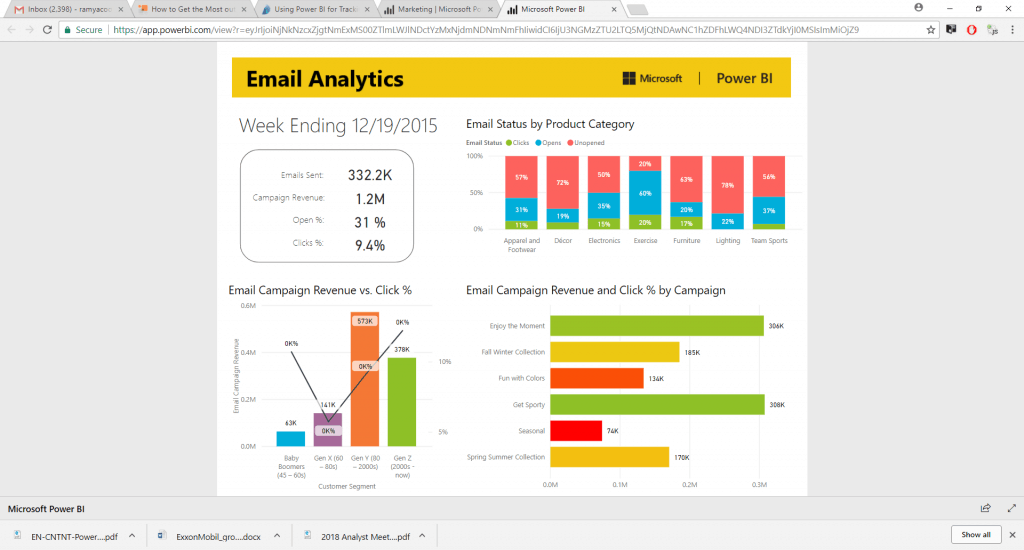
E-Mail Marketing is one of the major marketing initiatives of any business. Power BI has data connectors for two specific e-mail marketing tools – Sparkpost, and MailChimp. These aren’t the only options. This is because, companies using CRM platforms such as MS Dynamics, Salesforce, and Marketo can also easily connect their e-mail marketing data with Power BI. Power BI can track the volumes of e-mails sent and answer questions such as:
- How many e-mail clicks are generated?
- What times during the day are e-mails typically accessed more?
- Unsubscribe rates, which subject lines generate maximum interest to open?
- How is the marketing campaigning performing? etc.
Web Analytics
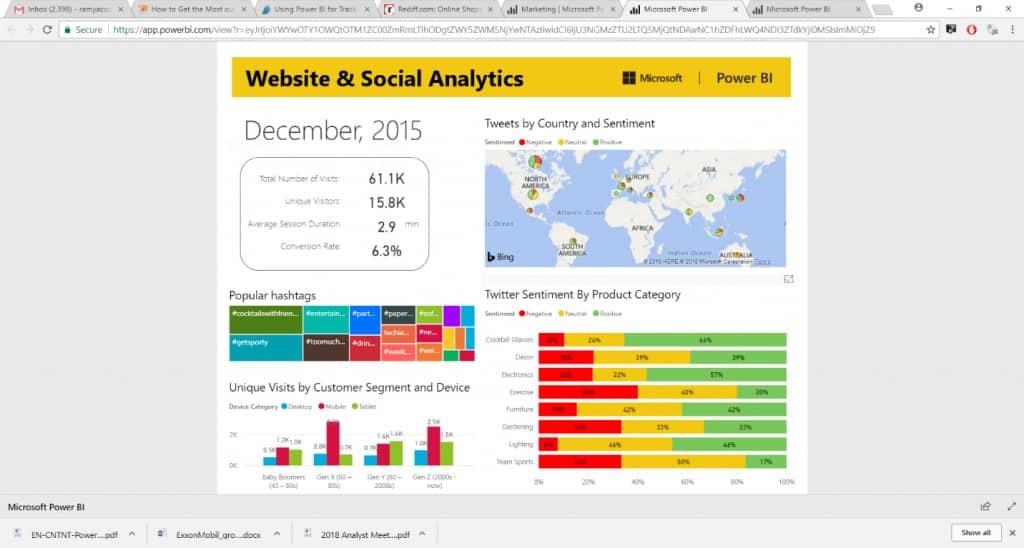
Power BI has data connectors for some popular data analytics platforms such as Google Analytics, Adobe Analytics, and comScore Digital Analytix, to analyze website metrics. Power BI also supports other analytics analyzers such as SweetIQ (focuses on local search) and app figures (mobile application analytics). An advertiser with Google Adwords and Google Analytics can connect to your account and track your Adwords performance with Power BI. Also, Power BI helps marketing professionals to organize data on its dashboard. You can just include separate spreadsheets containing various information onto your dashboard.
Case Study
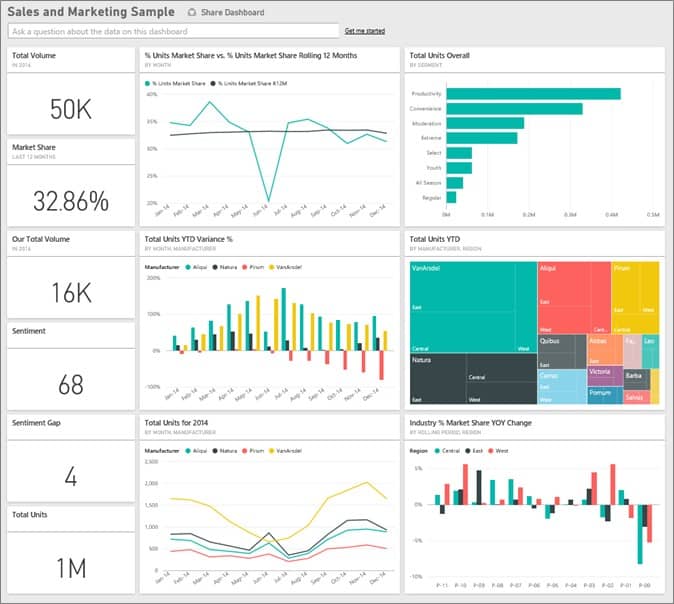
Let us take the illustration of a fictitious company ABC Ltd. ABC is the market leader in its industry but has many competitors. The company’s market share had begun to shrink, with significant dips in the month of June. Its Chief Marketing Officer (CMO) wants to find out why. The marketing guys want to increase its market share to reduce competition and increase growth. They have chosen to pin some information and insights on the dashboard:
Benefits of Power BI in Digital Marketing
You can achieve the following benefits by using Power BI for your digital marketing efforts:
- Availability of data across departments
- Data visualization – viewing reports or dashboard metrics with charts, graphs, or maps
- Better capabilities for updating current manual sources and automated data sources
- Retention of data that is saved in the cloud and not confined to user systems
Before importing all your data, you will want to strategize how it will be incorporated into your dashboards and reports. Strategies will vary depending on your goals, and often may come down to personal preference. You must choose the right approach amongst many right ones.
Spreadsheets usually contain ‘siloed’ data. Power BI can help you to create content pack groups with permission to view, edit, collaborate, and share dashboards and reports with others. It is possible to create your own dashboards based on a shared one, which can be collaborated with a new group. You can also add reports to your website, for sharing data with the public if needed. You can update files stored in your OneDrive or SharePoint account and keep updating them. Power BI will sync with these updates on an hourly basis and update them on your dashboard with the latest information.
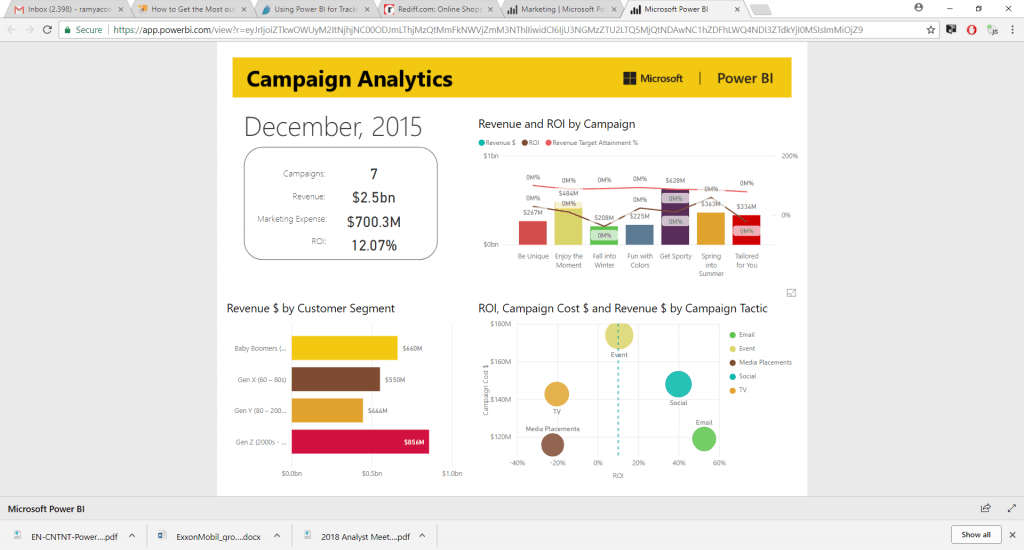
It is important to formulate a strategy to incorporate all your data into your dashboard before importing them. With Power BI, you can make informed decisions. This is because you can view your social media, e-mail marketing, and web analytics in a single platform. You can view and compare your marketing efforts easily and ascertain if you are on the right track.
The types of visualization on Power BI are beyond graphs and charts. You can pin snapshots of reporting data on your dashboard. Thereupon, these can go directly to a detailed report or another dashboard. Users can also view reports on mobile devices as Power BI has a mobile application for Windows, iOS, and Android.
Power BI is the perfect data visualization tool for marketers. ScaleupAlly as a Power BI Consulting Company can help you make effective reports and dashboards in Power BI. The reports can maximize your marketing RoI, assess the performance of your digital marketing plan, and help you come up with better strategies.
For more insights, you can drop us an email here.


